Moodle
Activities
Principal
investigator and supervisor:
Riccardo Mazza
Developer:
Mauro Nidola (as part of his diploma degree at
SUPSI)
Period:
September - October, 2005
Motivation
Currently,
many educational institutions and enterprises have set up Course
Management Systems (CMS) and are organizing their courses and
activities around these new technologies. The administrator of such a
software platform faces some difficulties in monitoring the
module’s usage in courses. In particular, if he want to
understand to what extent a particular module (for instance, Forum) has
been used in all the courses managed by the platform, we has to enter
each specific course, and trying to make sense of the usage that has
been done with the tool. Needless to say, a platform can run thousands
of courses.
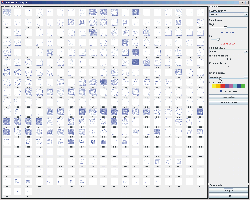
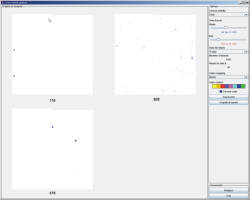
Description
This work proposes an approach to graphically represent the tracking
data in Course Management Systems in order to mine and discover the
usage of
specific software modules. We have implemented a tool that aim to give,
at a glance, a visual representation of the usage of a specific module
in all the
courses managed by the Course Management System. The tool allows also
comparing the usage in different courses, and seeing the distribution
of the usage during the time. This information is useful to
administrators of the Course Management System that have to know how
much the modules have been used in courses. But also, it could be
useful to instructional designers that have to design, plan, and
evaluate the learning needs in institutions.
Some graphical representations (click
on
these to have a larger image and a
brief explanation):
Riccardo Mazza. A graphical tool for
monitoring the usage of modules in Course Management Systems. In: IEEE EMBS Visual Information Expert
Workshop Paris, France - Apr. 24-25, 2006. To appear in
April 2006.
<-- back